Gridglyph
ENRO
Ask for a demo
New: taking on the first plants now

What every solar plant makes, loses and needs. In money.

Gridglyph is a small box on the plant's network and a web application. The box listens to what the plant's devices already say and sends it on. You get one place for production, incidents by what they cost, maintenance work, the network's security and tomorrow's market.

Ask for a demoHow it worksFlexible payment options
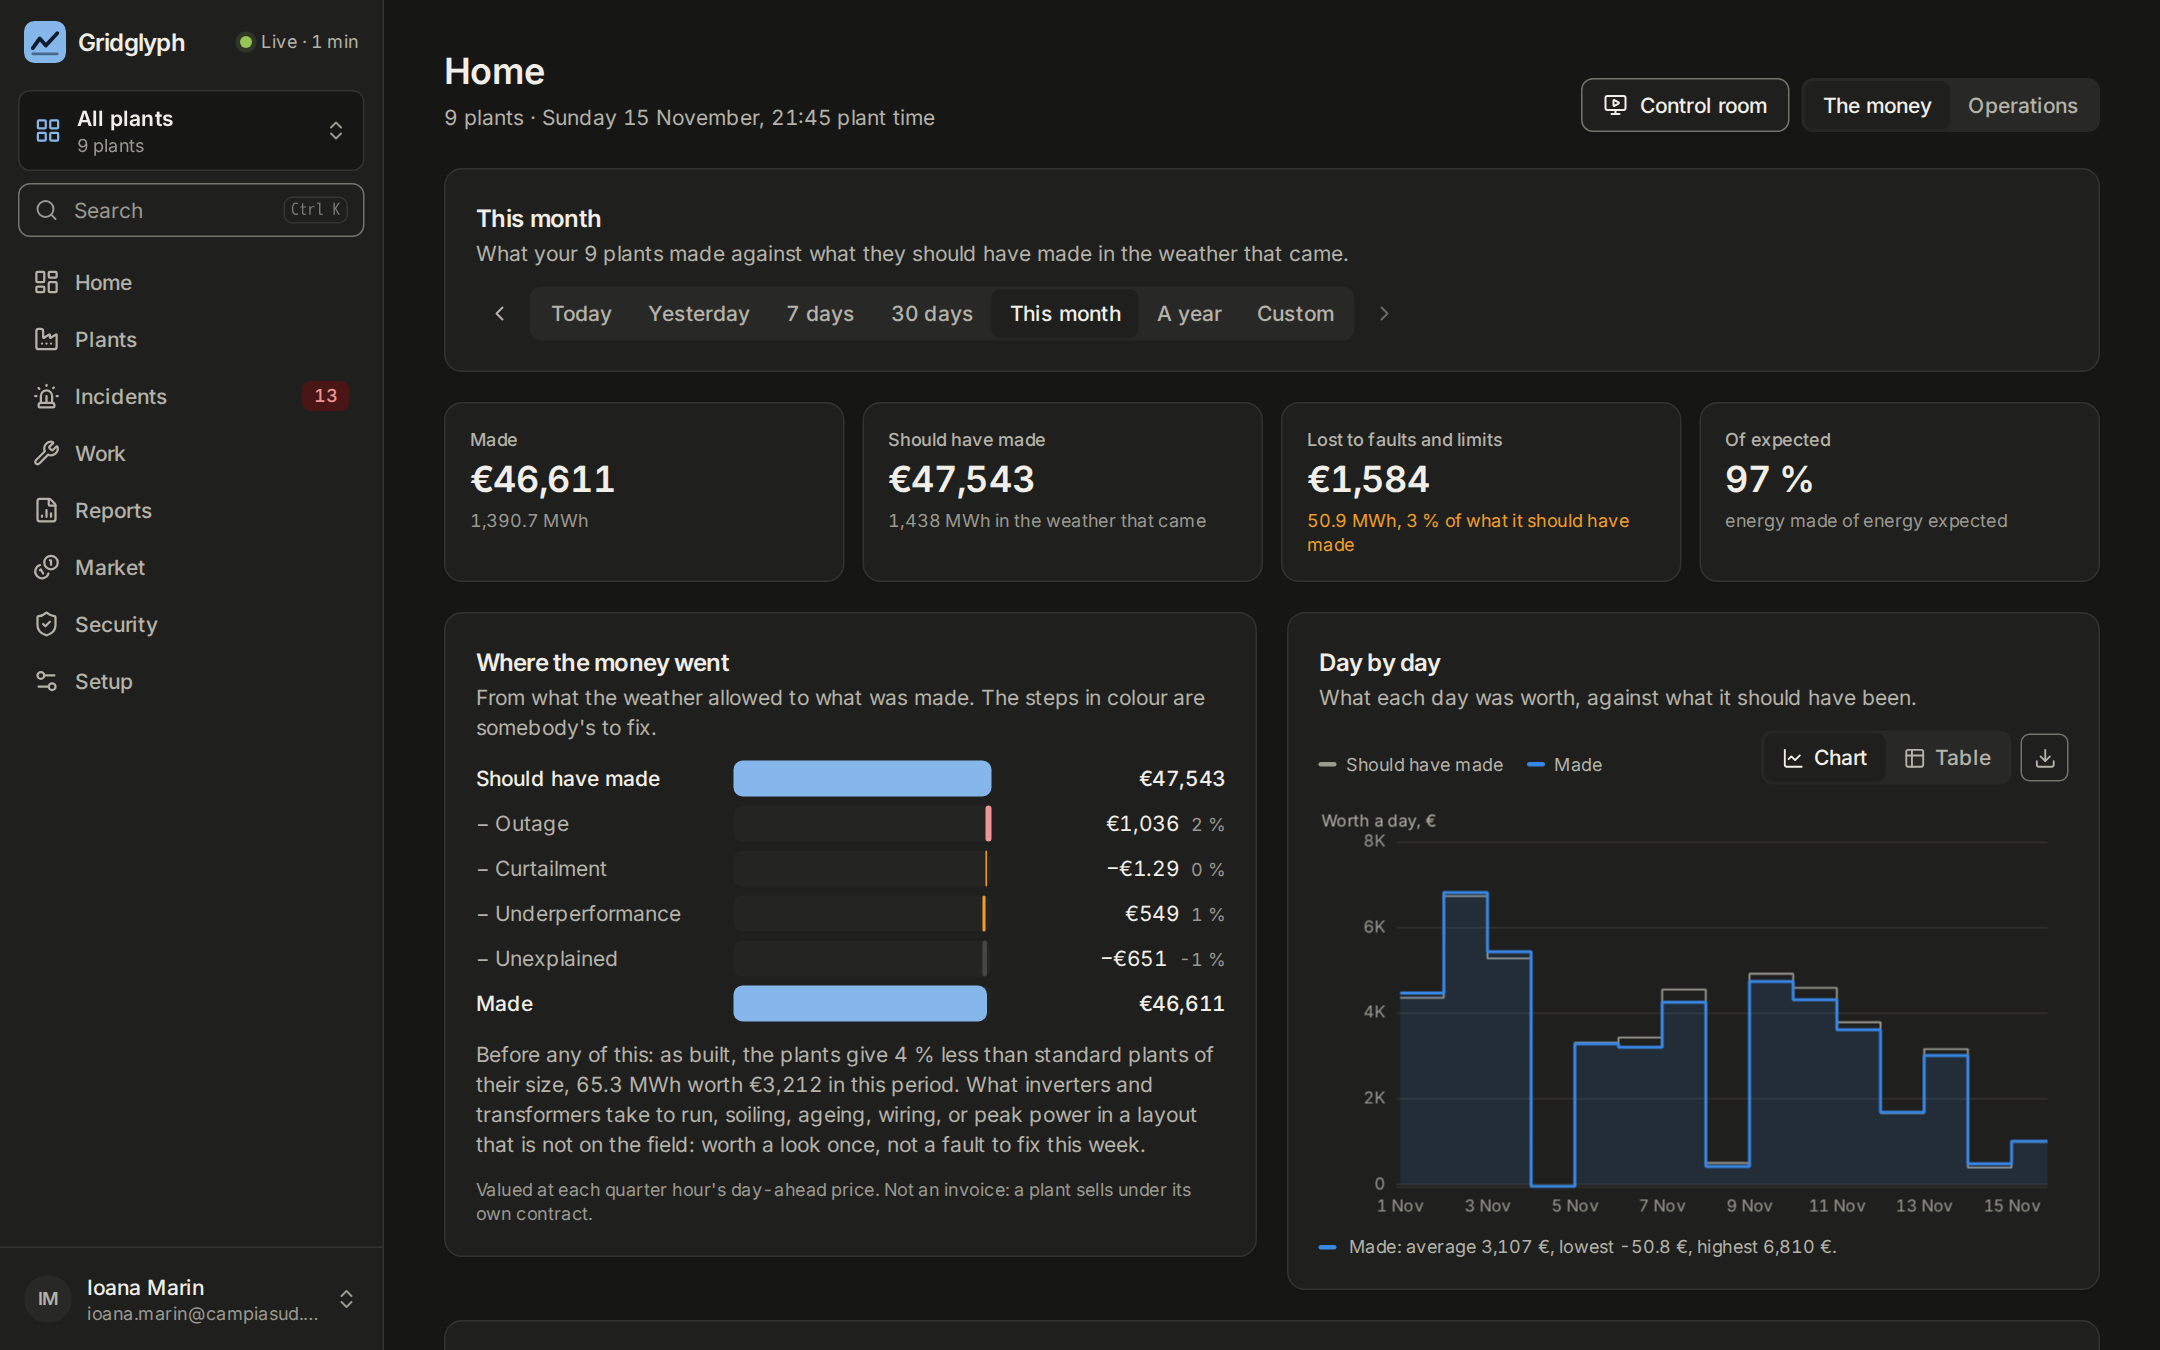
The owner's home page for the month: what nine plants made in euros against what they should have made, what was lost to outages, curtailment and underperformance, and each day's worth.
Demo data: a simulated portfolio.

It listens. It changes nothing.

The box reads the traffic the plant already has, from the switch's mirror port and the serial line. In its basic role it writes nothing to any device.

No list of registers to type in.

The box learns what each device is saying. The application proposes what every value means, and a person confirms it.

One place, for everybody who runs the plant.

The owner, the people who maintain it, the trader and the security officer look at the same plant, each from their own side.

For owners

The first question is money, not kilowatts

The home page says what the portfolio made today, what was lost and to what, and which open problem costs the most each day it waits.

  • Lost energy by cause: outage, underperformance, curtailment, the grid
  • Each plant measured against itself, not against a brochure
  • A monthly report and a health check to forward to a bank or a board
For the people who maintain it

One problem, one line, one job

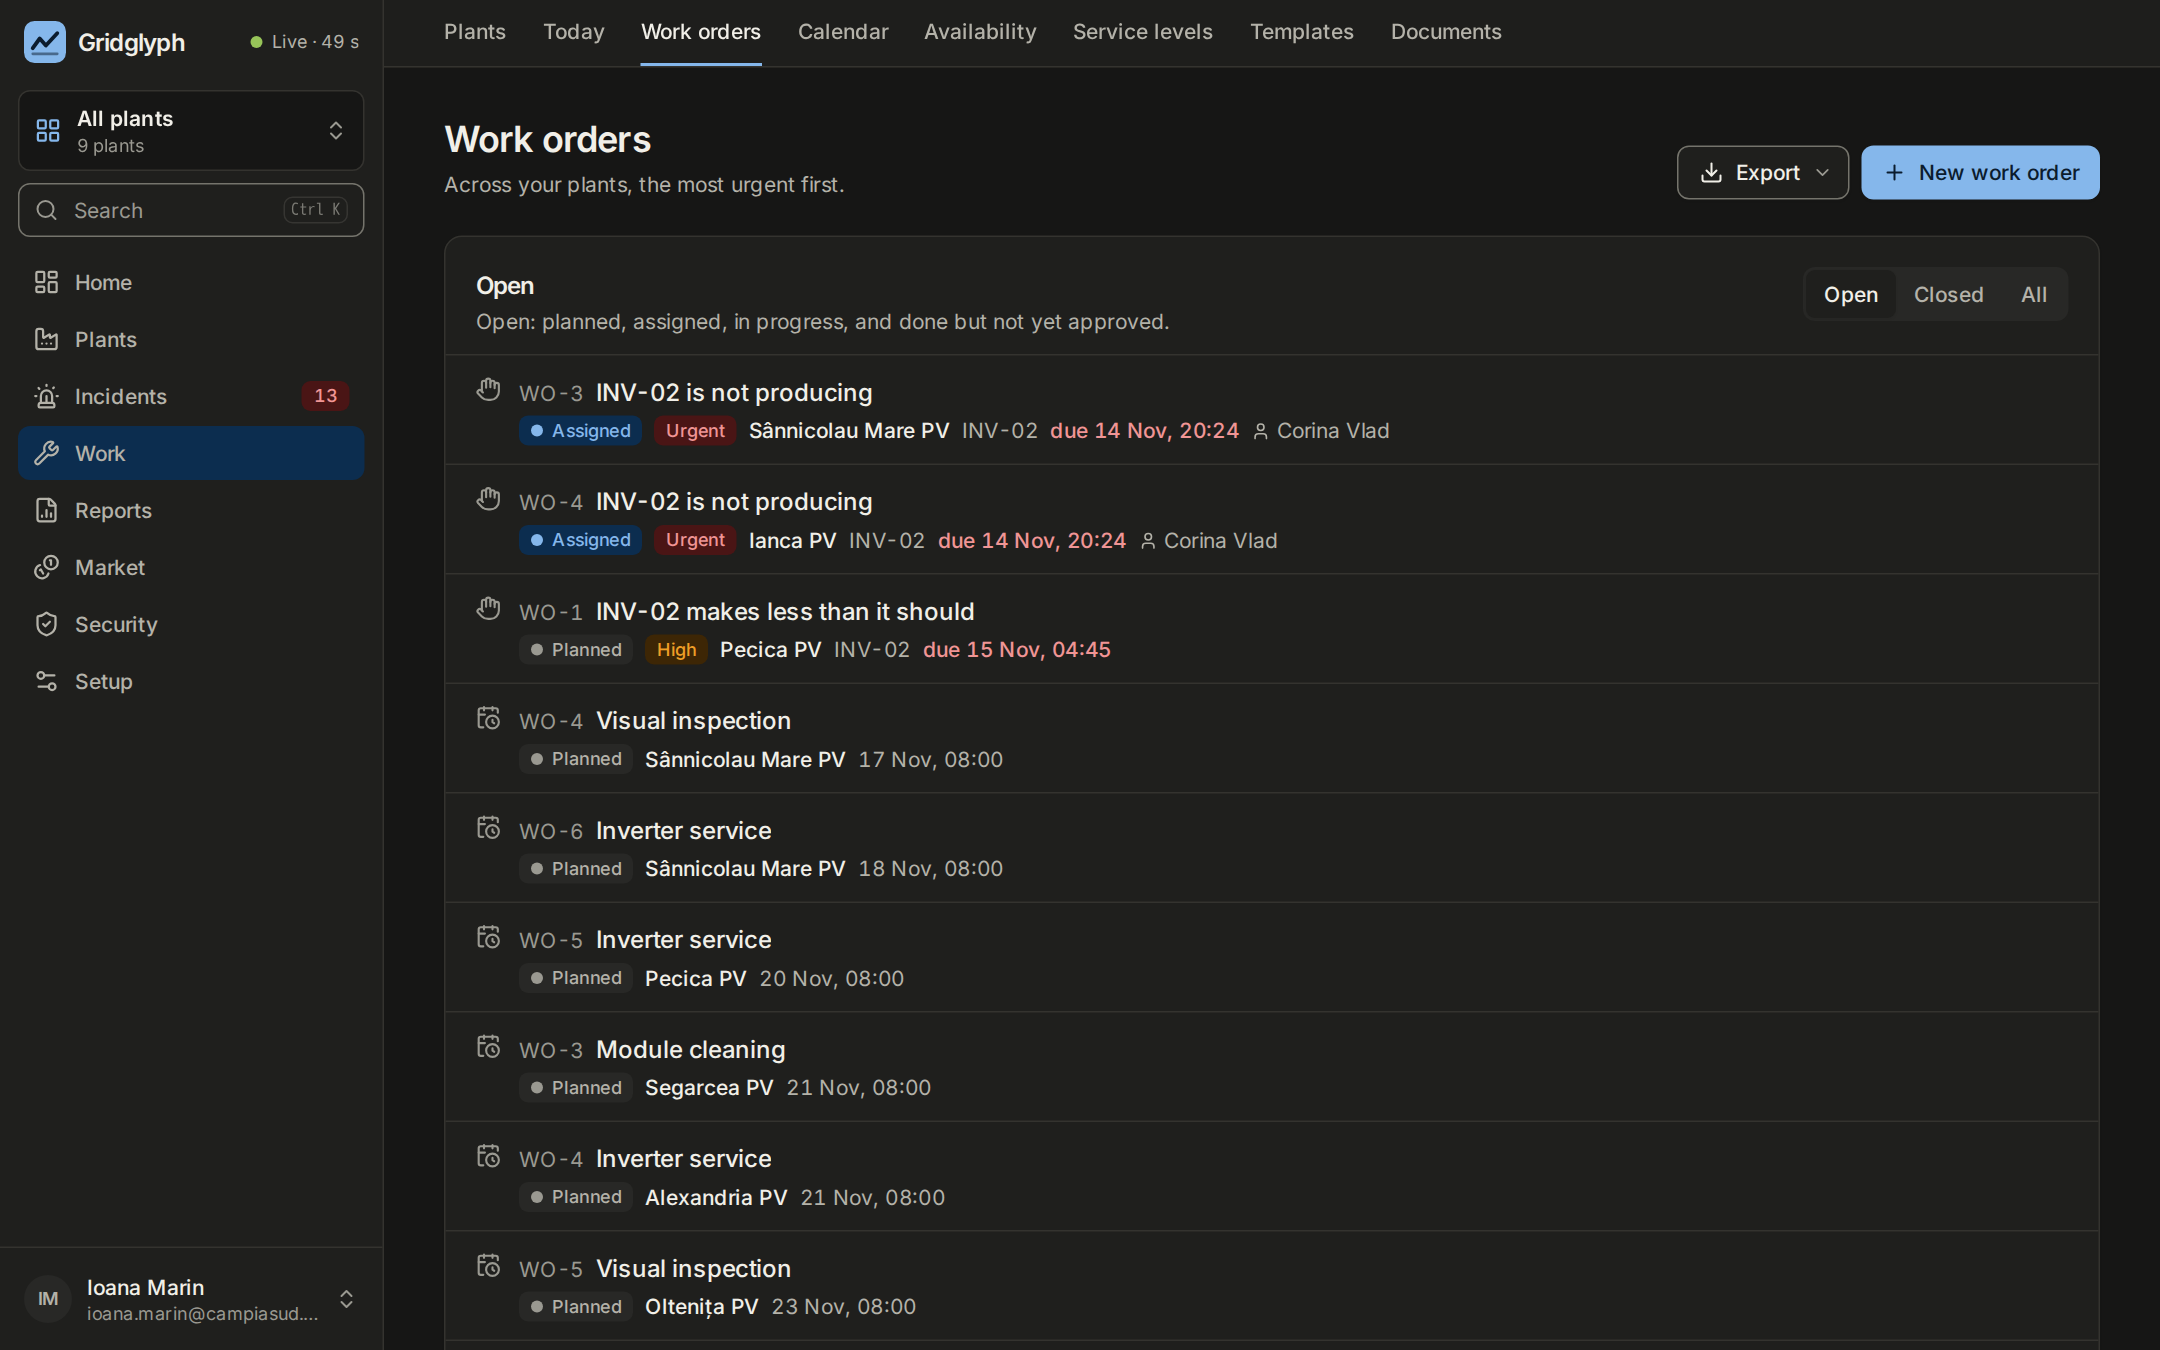
An alarm list says what rang. An incident says what is wrong, since when, and what it has cost. One click makes it a work order with that figure on it.

  • Maintenance plans, a calendar, planned outages
  • Work orders that work on a phone, with or without signal
  • Answered and fixed in time, measured against the contract
The work orders of a portfolio: two dead inverters assigned to a technician, and the planned visits of the coming weeks.
Demo data: a simulated portfolio.

For traders and aggregators

Tomorrow, on the market's own grid

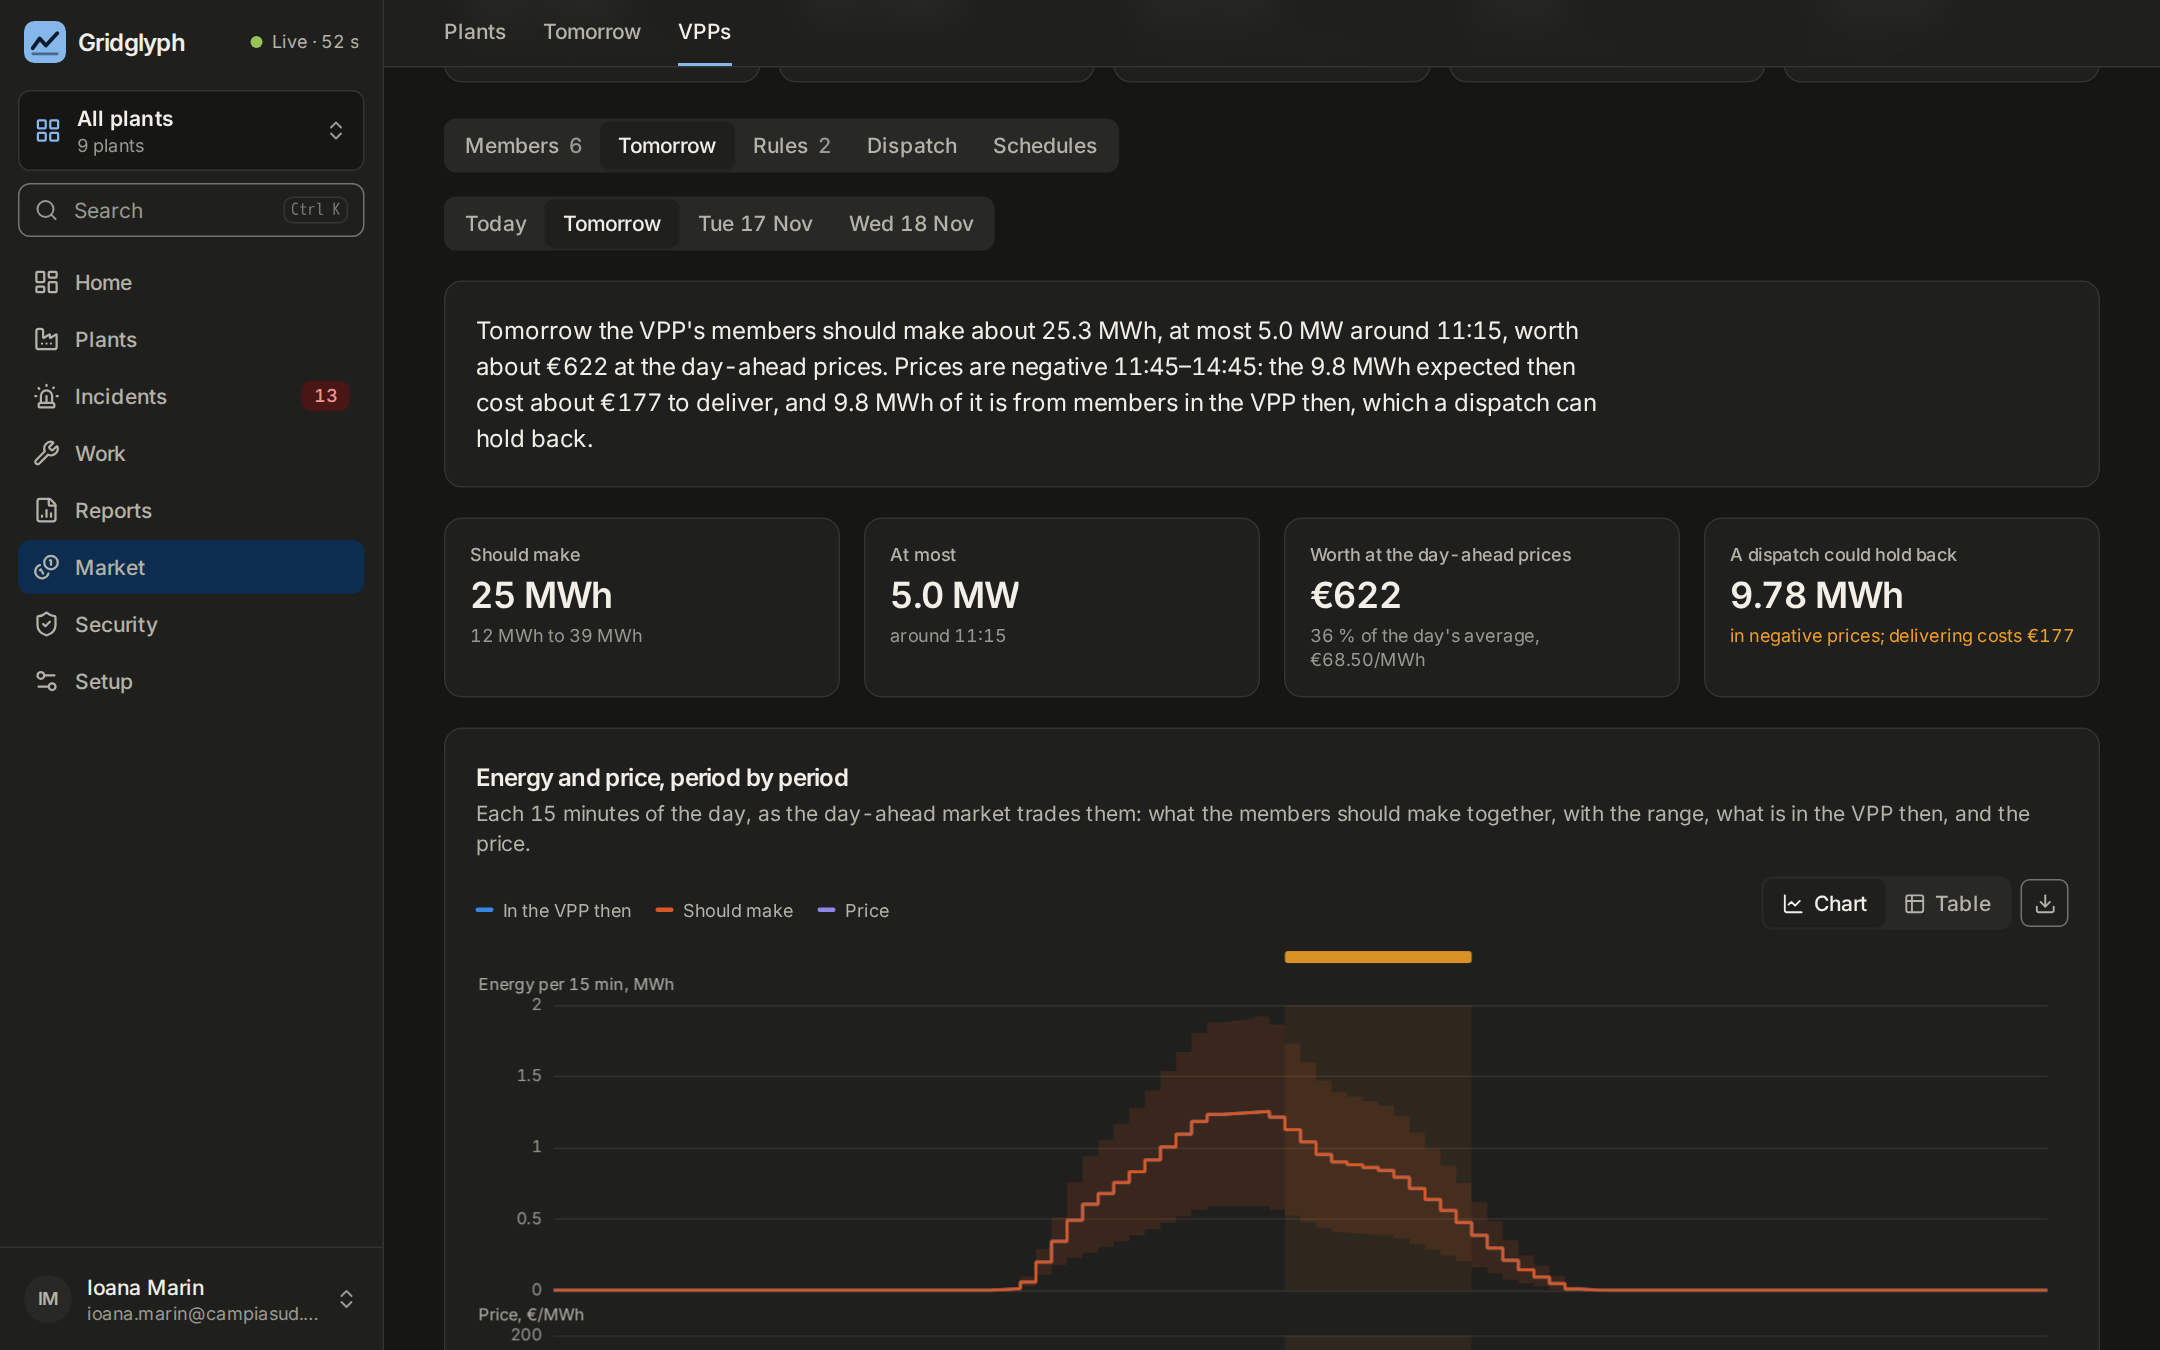
The forecast of each plant and of a whole virtual power plant in the 96 quarter hours the day-ahead market trades, with the price of each and the hours where delivering costs money.

  • Plants grouped into a virtual power plant, by schedule or by rule
  • A target shared among the members by priority, size or worth
  • Commands only with the owner's agreement, signed, and checked by the box
A virtual power plant's day ahead: expected energy and price in each quarter hour, with the hours of negative prices marked.
Demo data: a simulated portfolio.

For the security officer

Every device on the plant's network, and what is new

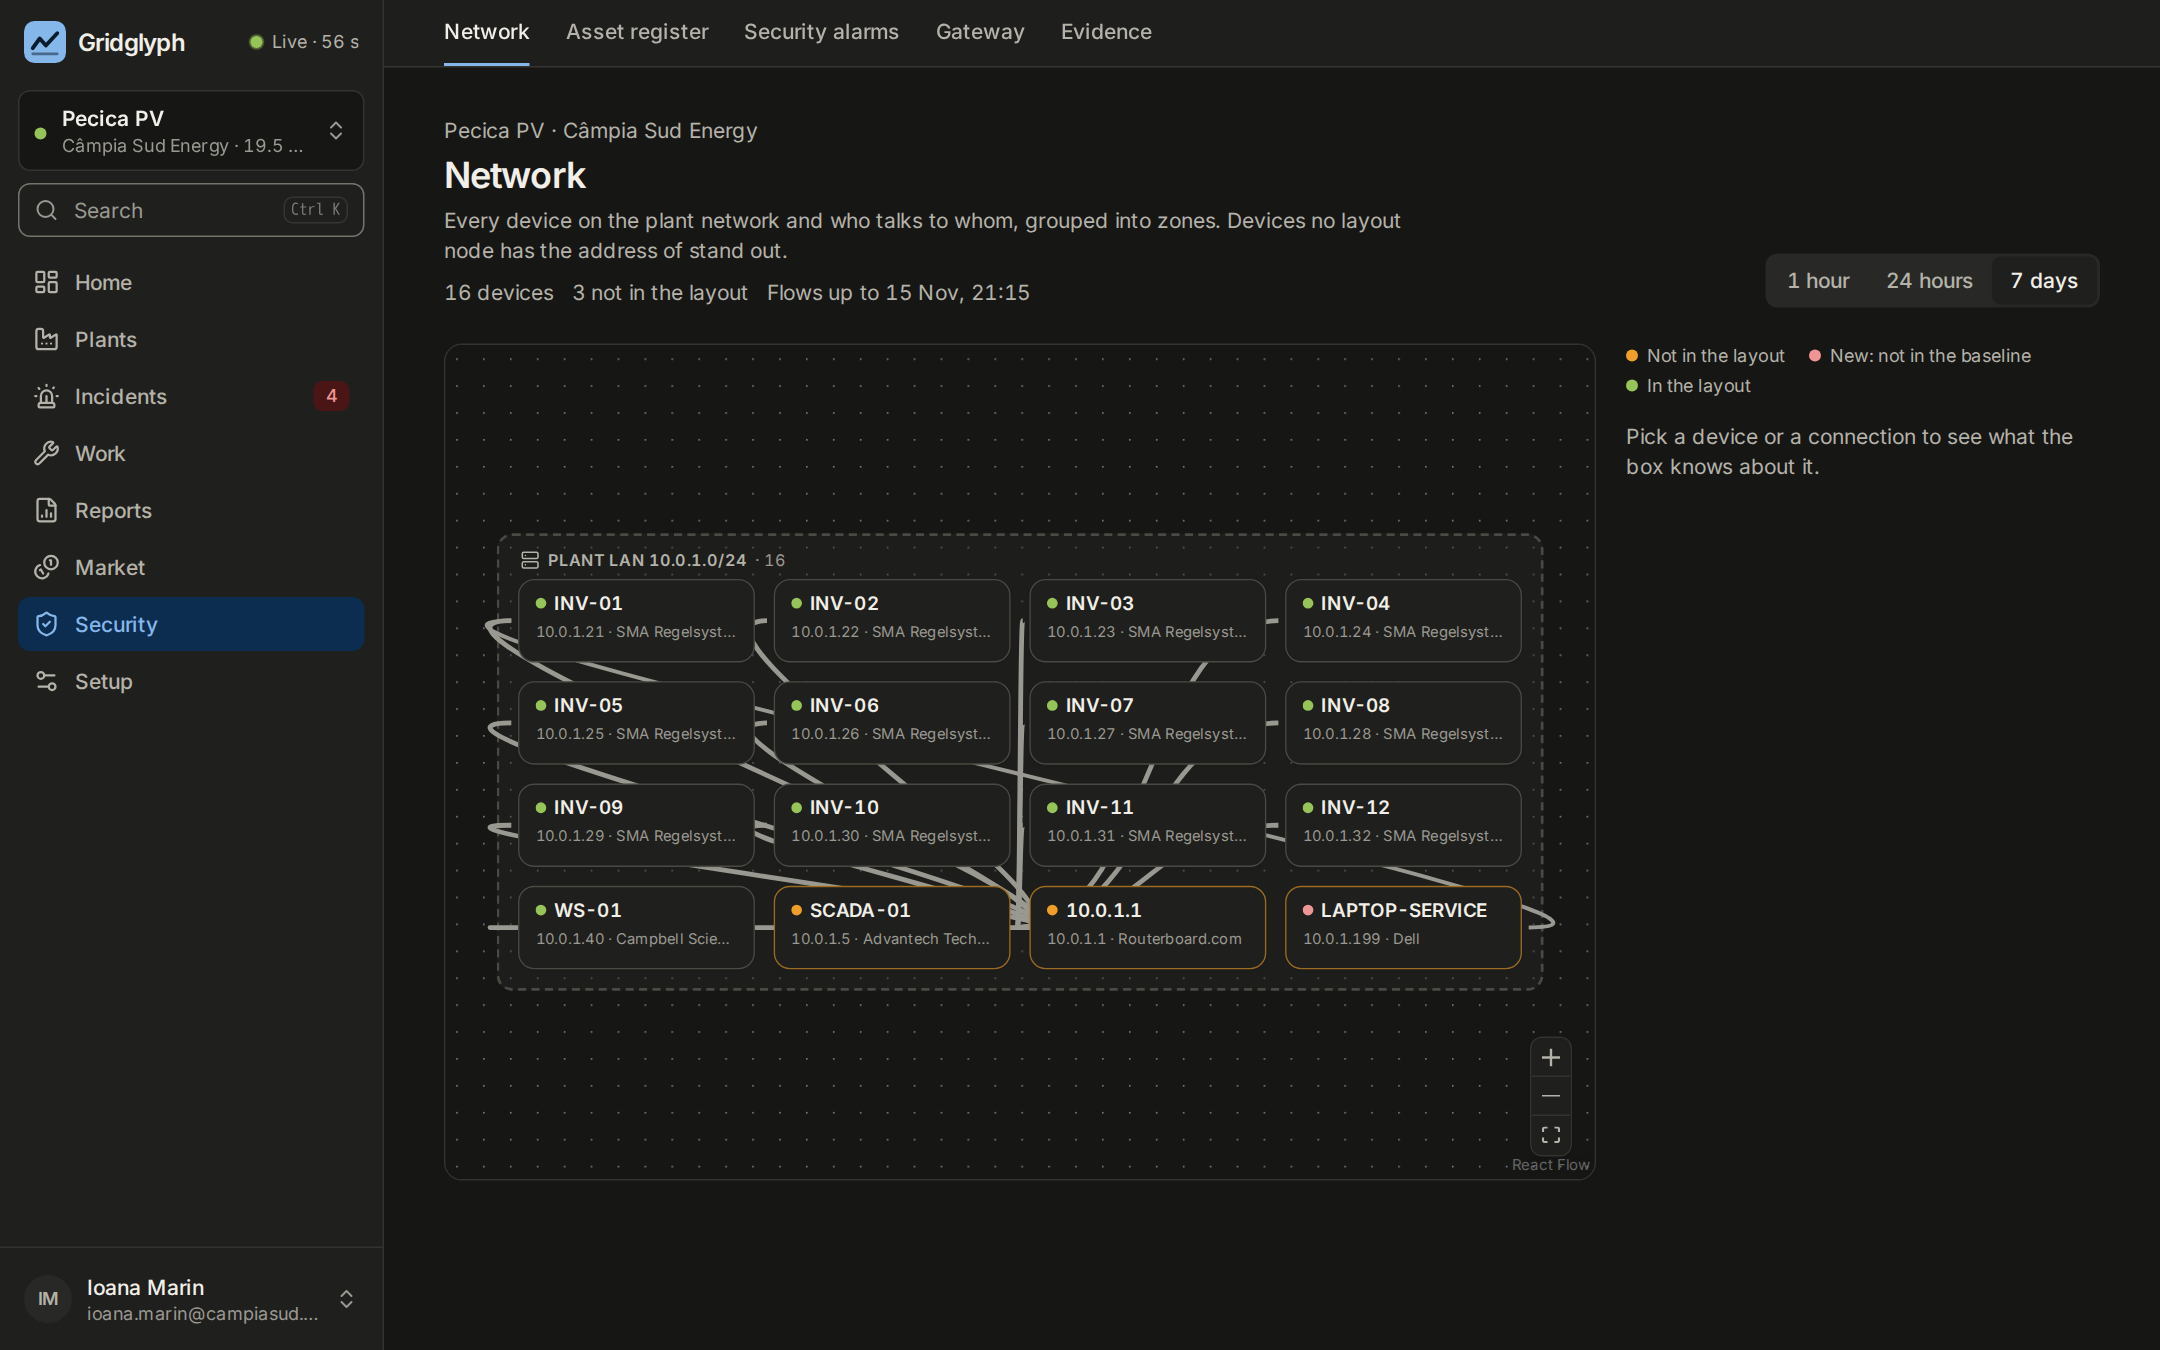
The box lists what is on the plant's network and who talks to whom. After it has learned what is usual, it tells you about a device nobody knows, a write from somewhere new, or equipment that starts calling out.

  • An asset register that fills itself
  • Findings with the evidence beside them
  • A file of evidence to support your NIS2 work
A plant's network: its inverters, meter and weather station, and a laptop that was not there before, marked as new.
Demo data: a simulated portfolio.

See it on a portfolio of nine plants

A demonstration takes fifteen minutes and needs nothing from you. If you have a plant to try it on, we bring the box.

Ask for a demoFlexible payment options